Abstract Chapter objectives
- To understand the basic theoretical and practical concept of UV-Vis spectrometry
- To be able to prepare, execute and evaluate a UV-Vis measurement
- To recognize practical problems and understand the limitations of UV-Vis spectrometry
IN DRAFT
LevelBasic
Advised for:
- Teachers in universities, colleges and lab schools who give courses in spectroscopy basics.
- Students in universities, colleges and lab schools who take courses in spectrometry basics.
- Employees in industry who operate UV/Vis instruments in routine and research environments with a need to understand the technique they are using.
In UV-Vis, a beam with a wavelength varying between 180 and 1100 nm passes through a solution in a cuvette. The sample in the cuvette absorbs this UV or visible radiation.
I0 is the radiation coming in,
I the radiation coming out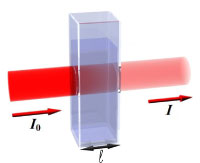
The amount of light that is absorbed by the solution depends on the concentration, the path length of the light through the cuvette and how well the analyte the light absorbs at a certain wavelength. The transmittance I/I0 is an indication of the concentration of the analyte in the sample. I/I0 is defined as the transmittance (or transmission) T. If there is no absorption of the light passing through the solution, the transmittance is 100%.
The most-used term in UV-Vis spectrometry to indicate the amount of absorbed light is the absorbance, defined as: A = - log10 T = -log10 (I/I0).
1/T = 10(A)
For UV-Vis spectrometry we use a spectrophotometer.
Here’s how a spectrophotometer works (1 minute):
The relation of absorbance to concentration is given by Lambert-Beer's law (Beer's law): A = ɛlc
(where A is absorbance (unitless), ɛ (epsilon) is molar absorption coefficient (or molar absorption constant) of the analyte for a certain wavelength (l⋅mol-1⋅cm-1), l is path length (cm) through your cuvette and c is the concentration of the analyte (mol⋅l-1).)
- For analytes that can be dissolved in solvents like water, ethanol and hexane.
- The analytes need to absorb UV or visible light.
- With UV/Vis we can do quantitative measurements a single analyte in solution (Or more than one analytes in solution provided thay do not interfere with each other.)
- Analytes that have a photochemical reaction at (or above) the wavelength range of interest.
- Unclear or colloidal samples.
Solutions suitable for UV-Vis analysis
PP Chapter 14 Selection Slides 2 t/m 8. Absorption by organics
PP Chapter 14. Selection Slides 9,10. Absorption by inorganics
Analyzing mixtures.
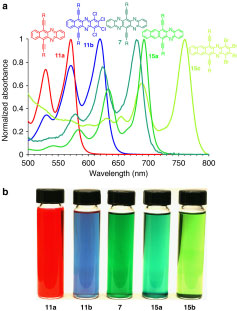
Compounds that absorb UV or visible light have a UV/Vis spectrum. Mixtures we can analyze If the UV/Vis spectra of compounds differ sufficiently from each other (‘have different molar absorptivity constants’).
In most practical situations, there is more than one analyte to be measured. For this we have Beer's law of mixtures.
PP Chapter 6: 2,3,4.
Different components have different absorption spectra
Q2.1 Can you find more solvents? / Please go on the web and find some more solvents
Q2.2 Is it possible to measure a UV-Vis spectrum of milk?
- An example of a UV/Vis measurement in practice.
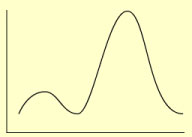
The UV-Vis spectrum shows the absorbance of one or more sample component in the cuvette when we scan through various wavelengths in the UV/Vis region of the electromagnetic spectrum.
- The x-axis (horizontal) shows the wavelength.
- The y-axis (vertical) shows the dependent variable; the absorbance.
Note: The wavelength region covered by a regular UV-Vis spectrophotometer is 200-1100 nm ( 1 nanometer, 10-9 meter) from the ultra violet (UV: 200-380nm), the visible (380-750 nm), into the near infra red (IR: above 750 nm).
This is only a very small part of the total EM (electromagnetic) spectrum.
By measuring and comparing a series of standard solutions -with known concentrations - of the analyte, the concentration of the analyte in the sample can be determined. The most important condition for an accurate measurement is: the concentration of analyte in the sample has to be in between the highest and lowest concentration of a series of standard solutions.
This following video outlines the theory of absorbance to support students (3:36 mins): (ipad users click this link )
Mary Kate: ch310 chapter 14Appls UVVis Mol abs. Slides 1-21 instrumentsThis gives both a summary of the previous chapters as an introduction of the next chapter
UV-Vis spectrometry is simple, inexpensive and easy to use. It is applicable for many different not too complex samples. Therefore UV/Vis is used in a broad range of areas, mainly for routine measurements, for example in hospitals, petrochemical industry, food industry, water quality control laboratories. Also universities, chemical and biological plants use UV-Vis.
UV-Vis spectrometry is not only used for routine measurements. In laboratories UV-Vis detection can be used to monitor the separations in liquid chromatograpy as seen in figure a). If a mixture is separated in a column the different compounds can be detected with a UV-Vis detector. UV-Vis detection is a relative cheap and easy detector compared to mass spectrometry (MS) detectors. UV-Vis detection can also be used in combination with a MS. In an industrial environment UV-Vis detection can be used to monitor processes.
UV-Vis detection is used in many areas

OPTIONAL: Expert who explains
- themselves and their company
- Why they use UV-Vis spectrometry
- What kind of samples they analyze with UV-Vis spectrometry
- Their tips and tricks concerning UV-Vis spectrometry
- A question from the expert
Below some problems that can be solved with UV-Vis spectrometry in environmental and hospital laboratories:
Environmental
UV-Vis spectrometry is used as a quick, first non specific screening of unwanted compounds in water. By measuring the color of process water during the production of drinking water we can determine if there are unwanted compounds in the water. A UV-Vis spectrometer is much more sensitive for color than the human eye. Especially in the UV part of the spectrum it is helpful to perform a measurement since our eye do not see UV-light.
Determining the concentration of iron(III) in waste water:
The water has to be filtrated first to remove non soluble particles. After filtration a complexation reaction with a reagent is used to make the colorless Fe3+ -ions visable. Phenatroline is used for the complexation where after complexation ferroin is formed.
An overview of waste water analysis, the elements and their specific absorption wavelengths through this link from UCDavis.
Hospital
- Determination of the reaction rate of a (bio-)chemical reaction, e.g enzymatic reduction from NAD to NADH2.
- An overview of various analyses
- In the table (pdf) from Perkin Elmer several different analytes are given and the UV wavelengths which are used to monitor the reactions.
Some other examples from industry and forensics prepared by UCDavis.
Q1.1: Can you think of more examples of applications where UV-Vis spectrometry is used?