Abstract In this chapter the theoretical background behind the µGC technology will be discussed, the background of narrow and medium bore columns, micro-injector and micro thermal conductivity detector (µTCD).
LevelBasic
GC is a commonly used technique for compositional gas analysis. These measurements generally take place in the laboratory. Analysis times of 10 minutes to one hour is normal.
- In a process environment much faster analyses are required for the purpose of control of the subsequent processes.
- Analysis times of 30 seconds to a few minutes are required for process analysis.
The advantage of µGC are, besides the reduction in size of the instrument, speed and their detection limits. µGC technology uses narrow to medium bore capillary and micro packed columns. These columns in combination with an appropriate detector results in faster analysis and lower detection limits. This was described by Thijssen et al (7) in 1987 and Cramers et al in 1999 (8). It is an improvement compared to conventional GC techniques. Theory behind this describes (8) that the reduction of the characteristic diameter, being the inside of the column diameter for open tubular columns and the particle size for packed columns, is the best approach to increase the separation speed in gas chromatography (Figure 11). Hydrogen and Helium carrier are the best choice for higher carrier gas velocities. Lowest plate height (HETP) is achieved for N2 in the optimum for the carrier gas velocity but when increasing the carrier velocity through the column Helium and Hydrogen give lower plate heights as can be seen in figure 10.
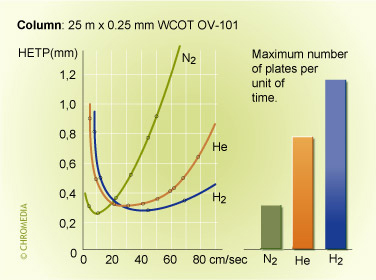 Figure 10: plate heights vs carrier gas velocity
Reduction of the inside column diameter results in a reduction in analyses time as displayed in below figure.
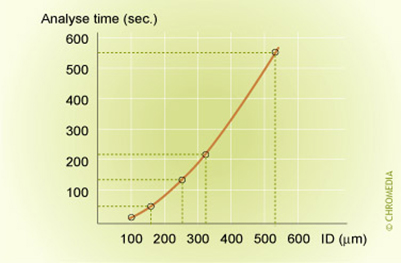 Figure 11: analysis time vs column ID (3)
A few reasons of the reduction of the total analysis time as described by (8) are:
1) Reduction of the characteristic diameter being the inside column diameter for open tubular columns and the size of particles for packed columns is the best approach.
The equilibrium between mobile and stationary phase is faster for narrow bore columns due to the relative distance for the molecules to get from the mobile to stationary phase. Analysis time can be reduced proportional to characteristic particle diameter dp2 and column diameter dc2 for respectively packed r capillary columns for p=1barg and linear proportional to dp or dc for p>>1barg.
2) Also the film thickness is of some influence. In thin-film the Cs-term in the simplified Golay equation (Figure 13) can be neglected.(e.g. df=0.4µm)
3) The influence of carrier gas type due to the diffusion coefficient and carrier gas viscosity is 60% worse for He compared to H2 (smaller molecule H2 compared to He). H2 is therefore the best choice. (for safety reasons He is often chosen in process analyses)
4) Temperature programming, higher temperature gives lower retention (10-15 C higher =2x lower retention). Temperature programming should be ultra fast for narrow bore columns.
5) Multiple capillary columns : 919 coated capillaries ID40 um 1m length, high sample capacity, fast due to the 919 parallel capillary columns. e.g. aromatics up to
o-xylene in 0.8 minutes.
The van Deemter equation expresses the relation between the plate height (H) and the gas velocity through the column (u).
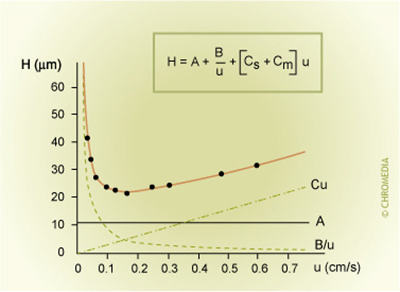 Figure 12: plate hight equation & the van Deemter H vs u curve
- H = HETP (plate height)
- A = eddy diffusion term
- B = longitudinal diffusion term
- u = linear gas velocity
- C = resistance to mass transfer coefficient
The terms A, B and C will influence the plate height and eventually the separation efficiency Nth. For narrow and medium bore columns in respect to wide bore or mega bore columns:
- A is smaller due to relative smaller particles in packed columns.
- B/u is smaller because the relative smaller travel distance of the molecules.
- C is relative smaller due to the smaller relative distance of the molecules from the mobile to the stationary phase.
- For thin films the Cs term can be neglected and consequently the plate height will decrease
For capillary columns the A term in the van Deemter equation, representing the column packing flow pattern will disappear due to the absence of column particles.
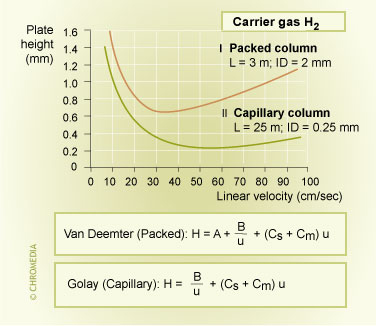 Figure 13: efficiency packed vs. capillary column
Ultra narrow bore columns with diameters < 100 µm are not advised, because they generate high pressure drops and have very limited loading capacity.
An alternative way of presenting the van Deemter equation as proposed by (9) is the time equivalent to a theoretical plate (TETP) as displayed in below figure. The curves for different particle size, or column diameter are displayed in the figure and the required plate number in the shortest possible time can be obtained.
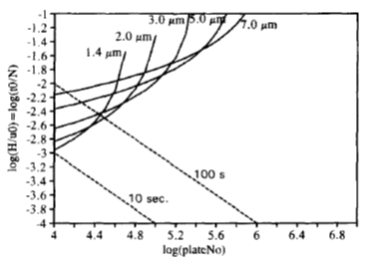 Figure 14: plot of time H/u vs required plate number (9)
Carrier gas flows through narrow- and medium bore columns are increased as the column diameter decreases.
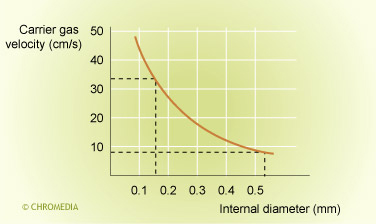 Figure 15: carrier gas velocity u vs column ID
This has a positive effect on the longitudinal diffusion term B/u and negative effect on the C*u term. The sample capacity is reduced proportional to dc3 for narrow bore open tubular columns (8) (with dc the column diameter). Therefore the selection of columns with larger diameter (medium bore) will have a positive effect on sample capacity and the minimum detectable quantity.
The columns used by Varian as described in 3.3.6 consisted of a Pora PLOT Q (PPQ) column and the columns used by SLS as described in 3.3.8 consisted of a micro separation column on a silicon chip with a Carbosphere type packing. Porous Layer Open Tubular (PLOT) columns are open tubular columns coated with a layer of solid porous material on the inside column wall.
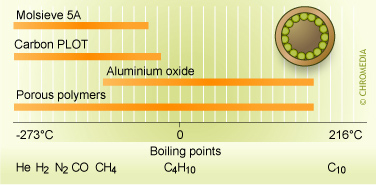 Figure 16: PLOT Columns application Areas
Porous polymers are prepared by the copolymerization of styrene and divinylbenzene or other related monomers. The silicon chip column consists of etched channels with a size of 0.3mmx550mm packed with carbon spheres of 1.3nm.
Other columns used by Varian as described in 3.3.6 and C2V as described in 3.3.9 consists of a non-polar CPSil5 liquid phase (df=5µm) and a CP-Volamine liquid phase (df=8µm),liquid phase 100% dimethylpolysiloxane. The CP-Volamine column (10) is a column coated with a thick film non-polar stationary phase optimized for the separation of volatile amines and NH3. Usage of a thick film (8µm) results in maximised shielding of activity of the column wall. Also the sample capacity will increase with the column’s liquid phase film thickness (ref. Table 3).
| Sample capacity of capillary columns (in ng per component) | |||||
| ID (mm) | 0.12 μm | 0.40 μm | 1.2 μm | 2.0 μm | 5.0 μm |
| 0.15 | 1 - 10 | 3 – 30 | 10 - 100 | - | - |
| 0.25 | 2 - 50 | 6 - 150 | 20- 500 | 30 - 800 | - |
| 0.32 | 5 - 100 | 15 - 400 | 50 - 1000 | 80 - 1500 | - |
| 0.53 | - | - | 50 - 1200 | 100 - 2000 | 200 - 5000 |
Chromatography is a 'physical' method of separation in which the components to be separated are distributed between two phases, one of which is stationary (stationary phase) while the other (the mobile phase) moves in a definite direction. If the stationary phase is a liquid phase the analyte molecules must dissolve in that liquid stationary phase and their separation is based on absorption. For the PLOT and carbosphere column type, separation is based on the adsorption of analyte molecules on a solid stationary phase.
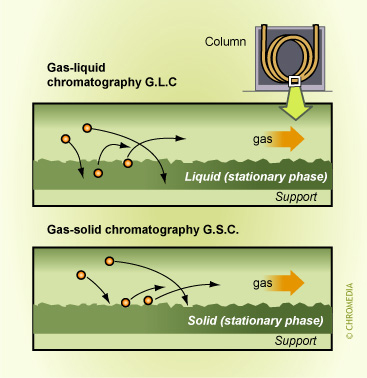 Figure 17: adsorption and absorption GC
To minimize the contribution of the input band-width (variance) to total band-broadening, the injected sample plug has to be narrow in comparison to the total chromatographic band broadening. In case of faster analyses the residence time of the components in the column is reduced. This results in a reduced chromatographic zone widening (i.e. the peak widths σw are reduced). Injection hence becomes more critical. This is especially true for isothermal analyses. In temperature programmed separations zone focusing will occur in the column inlet.
The theoretical value for the contribution of a plug injection to band-broadening (isothermal column operation) is given by (11):
![]()
where w is the width of the injected plug. Extreme small injection band-widths (σi) are required for very fast analyses on short narrow bore columns are approximately 1-3 ms (11). For the narrow bore option for fast GC the injection band-width is critical. It is for this reason that the development of injection systems compatible for narrow bore GC has received considerable attention in literature. For narrow and medium bore columns, for the µGCs used in this paper, the injection time frame is between 10-100ms. In two of the µGCs described in this paper a chip injector was used. Decreasing the injector volume could result in discrimination in the injector due to differences in viscosity of the sample components in the injector .
The thermal conductivity detector (TCD) is a universal detector based on the measurement of the thermal conductivity of a gas. The TCD measures the difference in heat conductivity between pure carrier gas and carrier gas containing sample components.
The core of the TCD is a filament, a thin wire often made of tungsten, platinum or nickel. Since the resistance of this filament is dependent on its temperature, a change in temperature will result in a change in resistance. This change can be detected electronically.
The thermal conductivity of the carrier gas and the analyte influence the peak signal. If the conductivity of the carrier gas is higher than that of the analyte, this results in a positive peak. The bigger the difference in conductivity of analyte and carrier gas, the better the heat transfer and results.
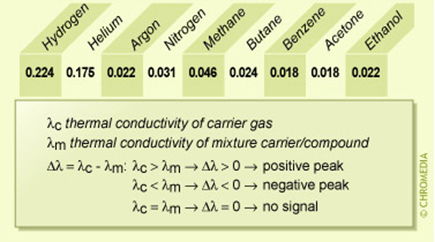 Figure 18: thermal conductivity of gases
Detection principle:
- A TCD usually has a double channel system. Pure carrier gas flows through one channel, the carrier gas eluting from the column containing the sample components flows through the other channel.
- Electrically heated filaments in each channel are cooled by the carrier gas. The amount of heat loss is a function of the thermal conductivity of the gas flowing through the cell.
- Both resistance filaments are part of a Wheatstone bridge. The bridge is in equilibrium if the composition of the gases is the same. The composition of the gas flowing through the reference cell does not change.
- A sample component passing the detector will change the composition of the gas. This results in a change in conductivity which, in turn will distort the balance. The resulting signal will be passed to the data recording system.
- The detector has the highest sensitivity when the difference in thermal conductivity between the carrier gas and the sample components is large. This is mostly the case with the lighter carrier gases, such as hydrogen and helium (the exception is when He and H2 need to be measured).
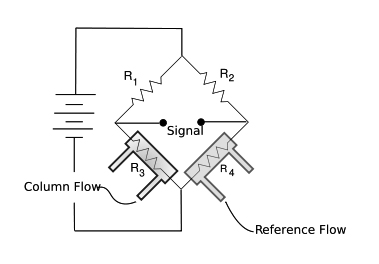 Figure 19: Thermal Conductivity Detector (TCD), the Wheatstone Bridge configuration
The µTCD is a solid state detector (SSD) it consist of 4 silicon micro machined air bridges (two each suspended in discrete parallel gas flow channels) coated with a metal filament, which, is heated. These are arranged in a wheatstone bridge configuration. Its volume is only 200nl. Its dynamic linear response spans 6 decades covering a concentration area from 1 ppmv to 100%v.
The µTCD’s concentration limit can exceed that of the Flame Ionisation Detector (FID).
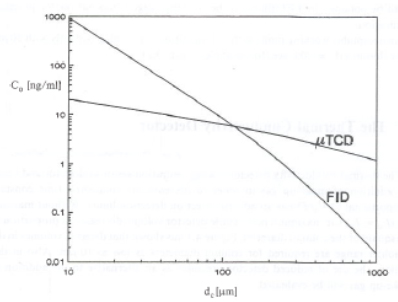 Figure 20: plot of minimum detectable concentration, Co, against column diameter dc , for n-C7 on a FID and µTCD (11)
From this plot it follows that for column diameters below 135µm the application of the µTCD becomes increasingly advantageous in comparison with the FID (11). Reduction of column diameter requires a reduction of the total band-width (variance) σt (σt2 = σi2 + σc2 + σd2 with i for injector, c for column and d for detector). For the detector the band broadening depends on detector volume and flow. Reducing the column diameter results in a reduction of the allowed detection volume.
The minimum detectable amount (Q0), i.e. the lowest quantity of solute that can be distinguished from the noise, is given by:
![]()
Where Rn is the detector noise, S the detector sensitivity, σt is the total band-width and Fd the total flow through the detector. The minimum detectable amount is favoured by a reduction of the inner diameter (The minimum detectable amount is proportional to the column diameter, Leclercq and Cramers, 1998) and basically by any other method that results in faster analysis. This is caused by the decrease of σt when the analysis time is reduced. The minimum detectable concentration on the other hand however, is not always improved when methods for faster chromatography are implemented. The injection volume might have to be reduced to avoid an excessive contribution of the injection to the overall peak width resulting in higher detection limits. Whereas this effect is marginal for most of the options for faster analysis, the minimum detectable concentration decreases dramatically when working with columns with a reduced inner diameter. Narrow bore columns therefore are not suitable for trace analyses. Also detectors have to be very sensitive to detect the low quantities eluting from a narrow bore column.
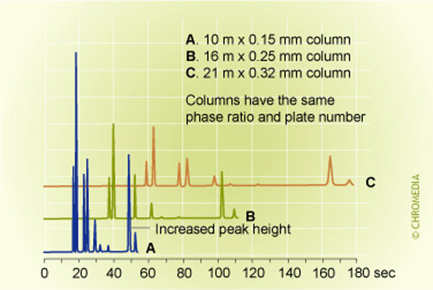 Figure 21: column diameter speed and detection limit at the same injection volume
The time constant of a detector (e.g. effects of resistance and capacitance in the detector electronics) will contribute to peak broadening and noise. Increasing by digital filtering will reduce noise and will have a positive effect on the detection limit (11). The peak width and time constant of a detector must be matched. A relative too fast detector may introduce unwanted noise while a relative too slow detector could result in peak deformation. For narrow bore columns the time constant for a detector should be relative small (fast enough detector and electronics) in comparison to a detector for normal bore columns in order to follow the fast chromatography.